
A new update has been released for Status Monitor Overlay , the tool allows players to monitor the Switch console’s system information during matches.
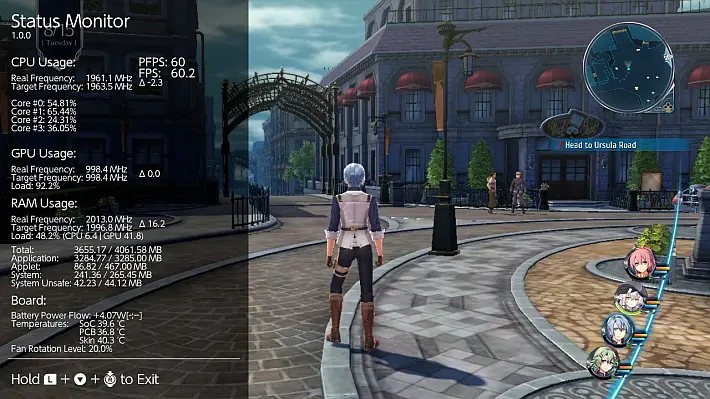
With this application, you can view the frequency of your CPU, GPU and RAM, as well as the temperature and fan rotation level.
This information can be useful for tracking system performance and monitoring temperatures during intense gaming sessions.
The tool features six different modes to choose from from the main menu, Full , Mini , Micro , FPS Counter , Battery and Miscellaneous .
The update introduces support for SaltyNX version 1.2.1 or higher , extending compatibility to a wider range of configurations.
The overlay can now read viewport resolutions in games using EGL and Vulkan, ensuring more accurate display of graphical information.
Additionally, a font cache has been implemented to reduce the impact of the overlay on overall game performance, although you can disable it by changing the value font_cachein the file if you wish config.ini, although this is not recommended.
Also fixed the behavior of Full and Mini modes, which now show only one resolution if only one is available, thus avoiding the display of a second null value such as “0x0”.
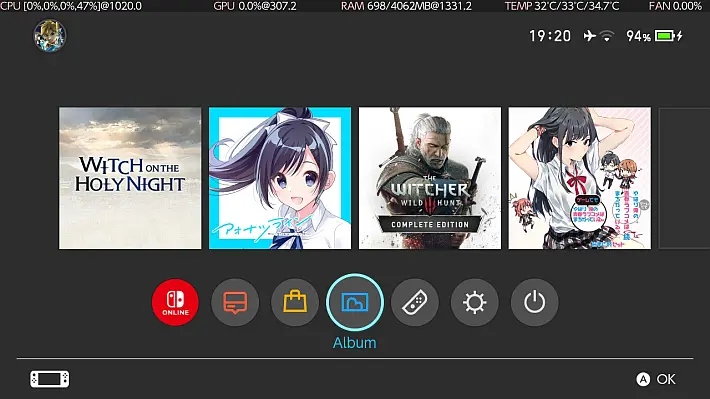
Finally, the developer clarified a known issue that affects some users: in some situations, opening the overlay or the Album menu can cause the system to freeze.
The cause is related to the large number of applications and sysmodules active at the same time, which compete for access to the SD card.
A temporary solution may be to disable SaltyNX logging via the SaltyNX- Tool , thus freeing up an extra session.
If the problem persists, it is recommended to temporarily remove or disable unused sysmodules via the dedicated overlay.
What is currently supported
- CPU usage for each core (cores
#0–#2are used by apps/games, core#3is used by the OS, background processes and also Tesla overlays). - GPU loading.
- Actual frequency of CPU, GPU and RAM.
- Used RAM classified as: (not supported by firmware <5.0.0).
- Total.
- Application.
- Applet.
- System.
- System Unsafe.
- SoC, PCB and skin temperatures (skin temperature not supported by firmwares <5.0.0).
- Fan rotation level.
- PFPS and FPS (with the help of NX-FPS 0.4+ , more information in the repository. Failure to install will result in no FPS counters being displayed on the overlay).
- Battery temperature, raw charge, age and average voltage
- Charger type, maximum voltage and maximum current.
- DSP usage.
- NVDEC clock frequency.
- Network type + Wi-Fi password.
Full
This mode can be known from previous versions of Status Monitor. It contains all the information correctly described and supported with high accuracy.View102550100elementsNear:
| Category | Format | Explanation |
|---|---|---|
| CPU Usage | Frequency: %.1f Core #0: %.2f Core #1: %.2f Core #2: %.2f Core #3: %.2f | Clock frequency of all CPU cores in MHz CPU Core #0 load calculated by IdleTickCount at percentage value CPU Core #1 load calculated by IdleTickCount at percentage value CPU Core #2 load calculated by IdleTickCount at percentage value CPU Core #3 load calculated by IdleTickCount at percentage value |
| GPU Usage | Frequency: %.1f Load: %.1f | GPU clock frequency in MHz GPU load provided by PMU in percent |
| RAM Usage | Frequency: %.1f %s: %.2f/%.2f | EMC clock frequency in MHz %s memory used / %s memory available in MB (not working with FW <5.0.0) |
| Thermal | SoC: %.2f (FW 14.0.0+: %2d) PCB: %.2f (FW 14.0.0+: %2d) Skin: %.2f Fan: %.2f | SoC temperature in degrees Celsius PCB temperature in degrees Celsius Skin temperature in degrees Celsius Fan rotation level in percent |
View 1 to 4 of 4 items❮1❯
Optional (shows only when NX-FPS plugin is installed)View102550100elementsNear:
| Category | Format | Explanation |
|---|---|---|
| PPFPS | %u | Frames pushed per second: How many frames were displayed in the last second |
| First person shooter | %.2f | Frames per second: value calculated by averaging the frame time |
View 1 to 2 of 2 items❮1❯
It only works in 1 and 5 Hz + vsync signal. You can change it with ++ .
Mini
Contains most of the information supported with lower precision.View102550100elementsNear:
| Category | Format | Explanation |
|---|---|---|
| Processor | [%.0f,%.0f,%.0f,%.0f]@%.1f | Core #0 Usage, Core #1 Usage, Core #2 Usage, Core #3 Usage at CPU Frequency |
| GPU | %.1f@%.1f | Load@GPU Frequency |
| RAM | %.0f/%.0f@%.1f | Total RAM used/Total RAM available at EMC frequency |
| TEMP | %2.1f/%2.1f/%2.1f (FW 14.0.0+: %2d/%2d/%2.1f) | SoC temperature/PCB temperature/skin temperature |
| FAN | %2.2f | Ventilation rotation level |
Showing 1 to 5 of 5 items❮1❯
Optional (shows only when NX-FPS plugin is installed)View102550100elementsNear:
| Category | Format | Explanation |
|---|---|---|
| PPFPS | %u | Frames per second pushed |
| FPS | %.2f | Frames per second |
View 1 to 2 of 2 items❮1❯
It only works in 1 and 5 Hz + vsync signal. You can change it with ++ .
Micro
Contains most of the less precisely supported information in one line.
Only show if you haven’t changed the overlay file name (so it should be Status-Monitor-Overlay.ovl).
This is because we need to reload the overlay to change the framebuffer size without taking up more RAM, and Tesla Menu (and libtesla with it) does not provide information about the filename of the overlay that has been loaded.View102550100elementsNear:
| Category | Format | Explanation |
|---|---|---|
| Processor | [%.0f,%.0f,%.0f,%.0f]@%.1f | Core #0 Usage, Core #1 Usage, Core #2 Usage, Core #3 Usage at CPU Frequency |
| GPU | %.1f@%.1f | Load@GPU Frequency |
| RAM | %.0f/%.0f@%.1f | Total RAM used/Total RAM available at EMC frequency |
| TEMP | %2.1f/%2.1f/%2.1f (FW 14.0.0+: %2d/%2d/%2.1f) | SoC temperature/PCB temperature/skin temperature |
| FAN | %2.2f | Ventilation rotation level |
Showing 1 to 5 of 5 items❮1❯
Optional (shows only when NX-FPS plugin is installed)View102550100elementsNear:
| Category | Format | Explanation |
|---|---|---|
| First person shooter | %.1f | Frames per second |
View 1 to 1 of 1 items❮1❯
It only works in 1 and 5 Hz + vsync signal. You can change it with ++ .
FPS Counter
It only shows the FPS value in 31Hz + vsync signal. If the game is not started, it will always show the value 254.0.
Mode only available with SaltyNX installed.
Battery
View102550100elementsNear:
| Category | Format | Explanation |
|---|---|---|
| Battery temperature | %.2f | Battery temperature in degrees Celsius |
| Raw battery charge | %.2f | Raw battery capacity charged in percent |
| Battery voltage (average 45s) | %.2f | Average battery voltage in mV |
| Charger type | %u | Type of charger connected, more in Battery.hpp “BatteryChargeInfoFieldsChargerType” |
View 1 to 4 of 4 items❮1❯
Only displayed if the loader type is other than 0:View102550100elementsNear:
| Category | Format | Explanation |
|---|---|---|
| Maximum charger voltage | %u | Charger and external device voltage limit in mV |
| Maximum charger current | %u | Charger and external device current limit in mA |
View 1 to 2 of 2 items❮1❯
Miscellaneous
View102550100elementsNear:
| Category | Format | Explanation |
|---|---|---|
| DSP usage | %u | In percentage |
| NVDEC clock frequency | %.2f | NVDEC Frequency in MHz |
| Network type | %s | Shows whether the Switch is connected to the Internet and whether it is using Ethernet or Wi-Fi |
View 1 to 3 of 3 items❮1❯
If the network type is “Wi-Fi”, you can press Y to show the password. Since the maximum password length is 64 characters, it can be displayed in up to 3 lines.
additional information
What is skin temperature (tskin)?
This is the temperature calculated from the SoC and PCB temperatures which is mainly used to prevent the Switch console from overheating. Reading is not supported on firmware lower than 5.0.0.
Explanation provided by CTCaer:
Temperature calculation (tskin).
Console and PDA:
tsoc >= 84°C – Instant sleep. No questions asked.
tpcb >= 84°C – Instant sleep. No questions asked.
Console only:
tskin < 63°C – Resets both timers.
tskin >= 63°C – Instant sleep. No questions asked.
Palm only:
tskin < 58°C – Resets both timers.
58°C <= tskin < 61°C – Starts the 60s timer and clears the 10s timer.
61°C <= tskin < 63°C – Starts the 10 second timer.
tskin >= 63°C – Instant sleep. No questions asked.
The two timers are separate. If 61°C is reached, the 10s timer starts immediately.
If a timer expires and the temperature is not lowered, it goes into sleep mode.
tskin is the specific calculation below:
soc_adj = (temps.iir_filter_gain_soc * (temps.soc - temps.soc_adj_prev)) + temps.soc_adj_prev;
pcb_adj = (temps.iir_filter_gain_pcb * (temps.pcb - temps.pcb_adj_prev)) + temps.pcb_adj_prev;
temps.soc_adj_prev = soc_adj;
temps.pcb_adj_prev = pcb_adj;

if (soc_adj >= 38000)
{
    if (temps.handheld)
        soc_adj = (temps.tskin_soc_coeff_handheld[0] * soc_adj) + (1000 * temps.tskin_soc_coeff_handheld[1]);
    else
        soc_adj = (temps.tskin_soc_coeff_console[0] * soc_adj) + (1000 * temps.tskin_soc_coeff_console[1]);
    soc_adj = (soc_adj / 10000) + 500;
}

if (pcb_adj >= 38000)
{
    if (temps.handheld)
        pcb_adj = (temps.tskin_pcb_coeff_handheld[0] * pcb_adj) + (1000 * temps.tskin_pcb_coeff_handheld[1]);
    else
        pcb_adj = (temps.tskin_pcb_coeff_console[0] * soc_adj) + (1000 * temps.tskin_pcb_coeff_console[1]);
    pcb_adj = (pcb_adj / 10000) + 500;
}

skin_adj = MAX(soc_adj, pcb_adj); //tskin
Soon
- Add a graphics mode.
Requirements
- From version 0.4.1 you need to use Tesla Menu >=1.0.2.
troubleshooting
Question: When opening Full or Mini mode, the overlay shows Core #3 usage at 100% while everything else shows 0, eventually leading to a crash. Why does this happen?
Answer: There are a few possible explanations:
- You are using the nifm service connection test patches (for short
nifm ctest patches) that are included in various packages. These patches allow you to connect to a network that does not have an internet connection. But they cause nifm to randomly trigger when connected to the network. Find any folder in that has , and/oratmosphere/exefs_patchesin the folder name , delete that folder, and reboot your Switch. If you must use it, the only workaround is to use this overlay only in airplane mode.nifmnfimctest - You are using an untested custom system module that does not implement proper thread sleep. Find any system modules you do not need in atmosphere/contents, delete them, and reboot your Switch.
- Your Switch console is using sigpatches, is not a primary device, is using a linked account, and is connected to the network. Delete sigpatches, change your Switch to primary device, unlink your account, or turn off Wi-Fi.
Note: Sometimes Status Monitor crashes on startup, or the Album app freezes if Status Monitor is already active. This happens when there are too many apps and sysmodules running at the same time trying to access the SD card, you can disable SaltyNX logging using SaltyNX-Tool, in order to free up at least one session. If this doesn’t help, it is recommended to remove some sysmodules or kill them via Sysmodules Overlay when not in use .
Changelog
- Added support for SaltyNX 1.2.1+.
- Can now read viewport resolutions in games using EGL and Vulkan.
- Added a font cache to reduce the impact on game performance (can be disabled in the
config.inikey filefont_cache, but not recommended). - When there is only one resolution available to read, Full and Mini modes will only display that one, instead of displaying the second one as “0x0”.
Download: Status Monitor Overlay v1.2.1
Download: Source code Status Monitor Overlay v1.2.1
Source: gbatemp.net
Dịch Vụ Chép Game Tại TP.HCM – Hỗ Trợ Tất Cả Quận
Chép Game Ổ Cứng Ngoài Giá Rẻ – Hỗ Trợ PS, Xbox, Nintendo, PC
Dịch Vụ Chép Game PSP Giá Rẻ – Game Việt Hóa Cập Nhật Mới Nhất
Dịch Vụ Chép Game PSVITA Giá Rẻ – Game Việt Hóa Cập Nhật Mới Nhất
Dịch Vụ Chép Game PS2 Giá Rẻ – Game Việt Hóa Cập Nhật Mới Nhất
Dịch Vụ Chép Game NINTENDO SWITCH Giá Rẻ – Game Việt Hóa Cập Nhật Mới Nhất
Dịch Vụ Chép Game PS5 Giá Rẻ – Game Việt Hóa Cập Nhật Mới Nhất
Dịch Vụ Chép Game XBOX 360 Giá Rẻ – Game Việt Hóa Cập Nhật Mới Nhất
Dịch Vụ Chép Game PS3 Giá Rẻ – Game Việt Hóa Cập Nhật Mới Nhất
Dịch Vụ Chép Game PS4 Giá Rẻ – Game Việt Hóa Cập Nhật Mới Nhất
Dịch Vụ Chép Game PC Giá Rẻ – Game Việt Hóa Cập Nhật Mới Nhất